Your customer taps a product link from Instagram, waits three seconds staring at a blank screen, and hits back. You just lost a sale. Meanwhile, your competitor’s page loaded in under two seconds, captured the click, and closed the deal. This scenario plays out thousands of times every day across ecommerce stores, and page speed is the silent killer behind it. If you run a Shopify, WooCommerce, or Magento store and wonder why traffic doesn’t convert or why paid campaigns underperform, slow pages are likely bleeding revenue while you sleep. This guide shows ecommerce owners, marketers, and conversion rate optimization leads exactly how to diagnose sluggish templates, fix the bottlenecks that matter most, and reclaim the sales a one-second delay steals. You’ll walk away with a practical plan, a 15-minute audit checklist, and quick wins you can ship today without touching a line of code.
- Why Page Speed Matters for Ecommerce
- Core Web Vitals in 2025
- The 1-Second Effect on Conversions
- How to Measure Your Speed
- Quick Wins You Can Ship Today
- Platform-Specific Tips (Shopify, WooCommerce, Magento)
- Your 15-Minute Speed Audit
- A Simple ROI Calculator
- Common Pitfalls
- FAQs
- Key Takeaways
- Conclusion
Why Page Speed Matters for Ecommerce
Buyers arrive ready to purchase, but impatience runs high. A slow homepage or product detail page triggers an instant evaluation: if the site feels sluggish, trust erodes and the shopper assumes checkout will be equally painful. Mobile users, who now represent the majority of ecommerce traffic, face even tighter thresholds because they browse on smaller screens over cellular networks with variable latency. When your page takes more than three seconds to show meaningful content, bounce rate climbs and cart abandonment spikes. Shoppers who do stay convert at lower rates because friction accumulates with every laggy interaction, from image carousels that stutter to buttons that respond late.
Speed directly impacts revenue in measurable ways. Faster templates mean more sessions turn into completed checkouts, fewer shoppers abandon mid-funnel, and higher average order value because customers feel confident adding extra items. Beyond the immediate conversion lift, speed improves the efficiency of every dollar you spend on paid media. When landing pages load quickly, your cost per acquisition drops because more clicks convert. Search engines also reward fast sites with better crawl budgets and rankings, feeding organic traffic back into the funnel. Perceived trust rises when pages respond instantly, reinforcing your brand as professional and reliable.
- Ad efficiency improves when landing pages convert more clicks into buyers, lowering customer acquisition cost.
- SEO crawl budget expands as search bots index more pages per session on faster sites.
- Perceived trust strengthens when shoppers experience snappy interactions that signal a reliable checkout.
- Cart abandonment decreases because each step from product page to payment feels effortless.
- Average order value grows as confident customers add complementary products without hesitation.
Core Web Vitals in 2025
Core Web Vitals represent the most critical user-experience metrics that search engines and performance tools track. In 2025, three metrics dominate: Largest Contentful Paint, Interaction to Next Paint, and Cumulative Layout Shift. Each measures a distinct dimension of how real users perceive your site’s responsiveness and stability. Understanding these metrics helps you prioritize fixes that deliver both better rankings and higher conversions.
| Metric | What It Measures | Good Threshold | Typical Causes of Failure |
|---|---|---|---|
| Largest Contentful Paint (LCP) | Time until the largest visible element renders | Under 2.5 seconds | Unoptimized hero images, slow server response, render-blocking scripts |
| Interaction to Next Paint (INP) | Responsiveness to user clicks, taps, and keyboard input | Under 200 milliseconds | Heavy JavaScript execution, long tasks blocking the main thread, bloated frameworks |
| Cumulative Layout Shift (CLS) | Visual stability as elements load and settle | Under 0.1 | Images without dimensions, web fonts causing reflow, dynamic injected content |
How Core Web Vitals Relate to SEO and Conversion
Search engines use Core Web Vitals as ranking signals, particularly for mobile results. A site that consistently scores in the “Good” range across these three metrics gains a modest but meaningful boost in organic visibility, while stores stuck in the “Poor” band face downward pressure. Beyond rankings, these metrics correlate directly with user satisfaction. A fast Largest Contentful Paint means shoppers see your hero product image and call-to-action immediately, reducing the chance they bounce before engagement begins. Low Interaction to Next Paint ensures buttons and menus respond instantly, eliminating the frustration that drives abandonment. Stable layouts prevent accidental clicks on the wrong element, which destroys trust and sends users away. Optimizing for Core Web Vitals therefore improves both search performance and conversion rate in tandem.
The 1-Second Effect on Conversions
Even a single additional second of load time creates friction that compounds across your funnel. When a product page takes one second longer to render, shoppers grow impatient and second-guess their purchase intent. Mobile users and visitors arriving from paid ads prove especially sensitive because they expect instant gratification and have lower tolerance for delays. That extra second increases the likelihood a shopper taps back or closes the tab before ever seeing your offer, effectively wasting the click you paid to acquire.
The impact extends beyond immediate bounce. Slower pages depress conversion rates because each interaction feels labored, from scrolling through product images to clicking the add-to-cart button. Checkout abandonment climbs when payment forms lag, as customers worry the site might freeze or lose their order. Over time, these small delays add up to significant revenue loss, higher customer acquisition costs, and reduced lifetime value. A one-second delay doesn’t just cost you one sale; it erodes the efficiency of every marketing channel feeding traffic to your store.
- Higher customer acquisition cost emerges when more paid clicks fail to convert, forcing you to spend more per buyer.
- Wasted ad spend accumulates as landing pages fail to capture interest before visitors bounce.
- Lower email revenue results when subscribers click through to slow product pages and lose interest.
- Reduced average order value occurs because hesitant shoppers skip upsells and cross-sells when the site feels sluggish.
- Compounding funnel friction discourages repeat visits, shrinking lifetime value and organic word-of-mouth growth.
How to Measure Your Speed
Accurate measurement starts with understanding the difference between field data and lab data. Field data comes from real users visiting your site under actual conditions—varied devices, network speeds, and geographic locations. Lab data runs in a controlled environment using standardized settings, perfect for diagnosing specific issues but less representative of true user experience. Both types matter. Field data tells you what customers actually experience, while lab data helps you pinpoint the root causes and test fixes before deploying them.
Your toolstack should include PageSpeed Insights for a quick overview combining both field and lab metrics, Lighthouse for deep technical diagnostics, Chrome User Experience Report for aggregated real-user data, and WebPageTest for granular waterfall analysis across multiple locations and devices. Together, these tools give you a complete picture of where your site stands and which templates need urgent attention.
Step-by-Step Measurement Plan
- Create a list of your five most important templates: homepage, product listing page, product detail page, cart, and checkout.
- Open PageSpeed Insights and run each URL, recording both mobile and desktop scores for Largest Contentful Paint, Interaction to Next Paint, and Cumulative Layout Shift.
- Export the field data summary from Chrome User Experience Report if your site has sufficient traffic, noting the percentage of visits in the “Good,” “Needs Improvement,” and “Poor” bands.
- Launch Lighthouse in Chrome DevTools for one representative product page, using throttled mobile settings to simulate realistic conditions.
- Capture the opportunities and diagnostics sections, which highlight render-blocking resources, oversized images, and unused JavaScript.
- Run WebPageTest on your slowest template using a mid-tier mobile device and a 4G connection from a location matching your core market.
- Review the waterfall chart to identify bottlenecks such as slow server response time, heavy third-party scripts, or unoptimized fonts.
- Document the top three blockers for each template—commonly hero images without compression, render-blocking CSS or JavaScript, or excessive app and plugin requests.
- Prioritize fixes based on revenue impact, tackling checkout and product pages before homepage and static content.
What Good Looks Like
- Largest Contentful Paint consistently falls under 2.5 seconds on your top five templates, especially on mobile devices.
- Interaction to Next Paint stays below 200 milliseconds for critical actions like add-to-cart and checkout button clicks.
- Cumulative Layout Shift remains under 0.1, with no unexpected jumps as images, fonts, or dynamic content load.
- Time to First Byte registers under 600 milliseconds, indicating your server responds quickly to initial requests.
- Field data from real users shows at least 75 percent of sessions scoring in the “Good” band for all three Core Web Vitals.
Prioritization Rule
Fix issues on pages that directly drive revenue before optimizing templates with lower conversion impact. Checkout and payment pages come first because even minor speed improvements reduce cart abandonment and increase completed orders. Product detail pages rank second since they represent the final decision point before adding items to the cart. Product listing pages and category pages follow, as faster browsing encourages deeper engagement and discovery. Homepage optimizations matter least for most stores because visitors rarely convert directly from the landing page. Always allocate your effort where faster load times translate into immediate sales lift.
Quick Wins You Can Ship Today
Compress and Resize Images
Images typically account for the majority of page weight, and unoptimized photos directly inflate Largest Contentful Paint. Modern formats and responsive sizing let you serve lighter files without sacrificing visual quality, while lazy loading defers offscreen images until the user scrolls near them.
- Convert JPEGs and PNGs to WebP or AVIF formats using an image optimization plugin or service, reducing file size by 30 to 50 percent without visible quality loss.
- Resize hero images to match the actual display dimensions rather than uploading 4000-pixel-wide originals that get scaled down by CSS.
- Generate multiple sizes using responsive image markup so mobile users download smaller files than desktop visitors.
- Enable lazy loading for all images below the fold, ensuring only visible content loads immediately on page render.
- Set explicit width and height attributes on image tags to reserve layout space and prevent Cumulative Layout Shift as images load.
- Compress remaining JPEGs to 80 to 85 percent quality, which preserves sharpness while cutting file size significantly.
- Audit your largest product images first, starting with the hero shots on your ten best-selling product pages.
Time saved and impact: Compressing and resizing images often shaves one to two seconds off Largest Contentful Paint on image-heavy templates, with minimal effort required beyond running automated tools.
Tame Fonts
Web fonts add polish but can block rendering and cause layout shifts if not optimized. System font stacks eliminate external requests entirely, while careful tuning of custom fonts minimizes their performance cost.
- Consider using system fonts like Arial, Helvetica, or San Francisco that load instantly because they’re already on every device.
- If custom fonts are essential, limit your site to two font families and only the weights you actually use in templates.
- Apply font-display swap to ensure text renders immediately in a fallback font while your custom font downloads in the background.
- Subset fonts to include only the glyphs and character ranges your content requires, reducing file size by excluding unused symbols.
- Preconnect to font hosting domains early in the page load sequence, giving the browser a head start on establishing connections.
- Host fonts locally on your CDN rather than relying on third-party services that add latency and extra DNS lookups.
- Test fallback fonts to ensure they match your custom font’s x-height and spacing, preventing jarring shifts when the final font loads.
Time saved and impact: Optimizing fonts typically improves Cumulative Layout Shift noticeably and can trim 200 to 500 milliseconds off initial render, especially on slower mobile networks.
Kill Render-Blocking Resources
Scripts and stylesheets that block the browser from painting content are the leading cause of poor Largest Contentful Paint. Deferring non-critical resources and inlining essential styles lets the page render visible content faster.
- Defer JavaScript files that aren’t needed for above-the-fold content, allowing the browser to parse and paint the page before executing scripts.
- Load third-party tags like analytics, chat widgets, and social pixels asynchronously so they don’t delay visible content.
- Inline critical CSS—the minimal styles required to render above-the-fold content—directly in the HTML head, eliminating a blocking stylesheet request.
- Lazy-load remaining CSS for below-the-fold sections using media queries or JavaScript-based loading.
- Remove unused CSS rules from your stylesheets using a tool that analyzes which selectors actually apply to your templates.
- Concatenate and minify remaining external scripts to reduce the number of requests and total file size.
- Test deferring even your main JavaScript bundle if your content is primarily static or server-rendered.
Time saved and impact: Eliminating render-blocking resources often delivers the single largest Largest Contentful Paint improvement, sometimes cutting load time by two to three seconds on heavy pages.
Cache and CDN
Caching stores pre-rendered responses so repeat visitors and subsequent page views load almost instantly. Content delivery networks distribute static assets geographically, reducing latency for users far from your origin server.
- Enable server-side page caching for all non-personalized templates, storing fully rendered HTML that skips database queries and application logic.
- Set cache-control headers on static assets like images, fonts, and scripts to instruct browsers to store files locally for weeks or months.
- Deploy a CDN that caches assets at edge locations worldwide, ensuring shoppers in every region download files from nearby servers.
- Use stale-while-revalidate caching strategies to serve slightly outdated content instantly while fetching fresh versions in the background.
- Cache API responses for product data, inventory, and pricing with short expiration times, balancing freshness with performance.
- Purge cache automatically when you update products, adjust prices, or publish new content to avoid serving stale information.
- Monitor cache hit rates to ensure your CDN actually serves most requests from cache rather than forwarding them to your origin server.
Time saved and impact: Proper caching and CDN usage can reduce Time to First Byte from over one second down to under 200 milliseconds for cached pages, dramatically improving all downstream metrics.
Audit Third-Party Scripts
Apps, plugins, and third-party services inject scripts that run on every page, often consuming more resources than your core site code. Many stores accumulate dozens of these over time, each adding latency and blocking the main thread.
- List every app, plugin, and third-party tag currently active on your store, including analytics, chat, reviews, and marketing pixels.
- Remove any service you no longer actively use or that delivers minimal value compared to its performance cost.
- Load non-essential widgets like live chat or social feeds only when a user interacts with a trigger element, deferring the heavy script until needed.
- Replace client-side tracking pixels with server-side implementations where possible, offloading work from the browser to your backend.
- Consolidate multiple analytics and tag management platforms into a single solution to reduce redundant requests and script execution.
- Test your site with third-party scripts disabled to measure their true impact, then decide which are worth keeping.
- Set performance budgets for third-party code, capping the total weight and execution time allowed for external services.
Time saved and impact: Removing or deferring just two or three heavy third-party scripts can improve Interaction to Next Paint by 100 milliseconds or more and make the entire page feel noticeably snappier.
Platform-Specific Tips (Shopify, WooCommerce, Magento)
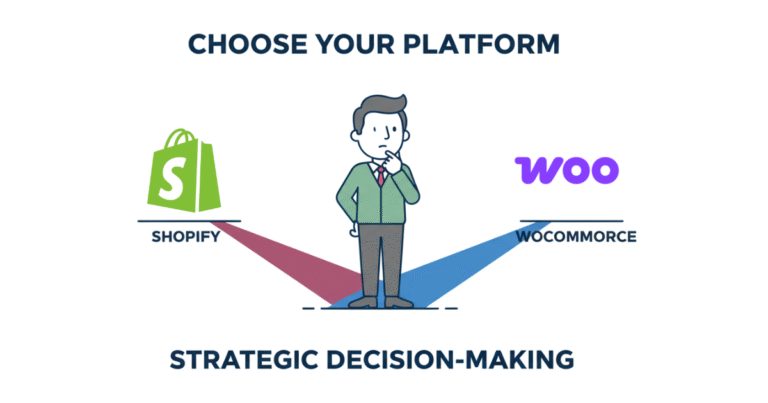
Shopify
Shopify themes often include numerous sections and blocks that load whether you use them or not. App scripts pile up quickly because the platform makes installation frictionless. Liquid templating and Shopify’s CDN give you strong fundamentals, but bloat from customizations and third-party code remains the main bottleneck.
- Audit your theme’s sections and disable any you don’t display on key templates, reducing the HTML and CSS the browser must parse.
- Uninstall unused apps entirely rather than just disabling them, as many leave residual scripts running even after deactivation.
- Use Shopify’s native lazy loading attributes on images rather than adding third-party lazy-load plugins that introduce extra JavaScript.
- Optimize your theme’s Liquid templates to avoid excessive loops and conditional logic that slow server-side rendering.
- Compress hero images before uploading them to Shopify, as the platform automatically generates responsive variants but starts from your original file size.
- Leverage Shopify CDN for all static assets and avoid hosting images or fonts on external services that add extra DNS lookups.
WooCommerce
WooCommerce runs on WordPress, which means plugin bloat and unoptimized PHP execution are common culprits. Shared hosting often throttles resources, leading to slow server response times. Heavy page builders and outdated themes compound the problem.
- Switch to a performance-focused hosting provider with PHP 8 or higher, adequate RAM, and object caching to handle dynamic WooCommerce queries efficiently.
- Disable and delete plugins you no longer need, paying special attention to page builders, sliders, and marketing tools that run on every page load.
- Install a caching plugin that supports WooCommerce-specific rules, ensuring cart and checkout pages remain dynamic while caching product and category pages.
- Optimize your database regularly to remove post revisions, transients, and orphaned metadata that slow down queries.
- Use a lightweight theme designed for speed rather than feature-heavy multipurpose themes packed with options you never use.
- Compress and lazy-load product images using a dedicated image optimization plugin, and serve them through a CDN to reduce origin server load.
Magento
Magento delivers enterprise-grade features but demands significant resources and expertise to optimize. Default configurations favor flexibility over performance, leaving stores slow unless you tune caching, indexing, and frontend rendering. Heavy JavaScript frameworks and large catalog sizes amplify the challenge.
- Enable full-page caching and configure Varnish or Redis to handle the majority of requests without hitting PHP and the database.
- Optimize your indexers to run incrementally rather than rebuilding the entire catalog on every change, reducing backend processing time.
- Minimize the number of custom modules and extensions, as each adds database queries and complicates caching strategies.
- Use Magento’s built-in image optimization and lazy loading, and ensure your catalog images are properly sized before upload.
- Tune your server configuration with adequate CPU, memory, and Elasticsearch resources to handle Magento’s demanding architecture.
- Consider moving to Magento’s PWA Studio or a headless frontend if your catalog is large and performance remains poor despite backend optimizations.
Your 15-Minute Speed Audit
- Open PageSpeed Insights and test your homepage, best-selling product page, and checkout page on mobile, noting the Core Web Vitals scores for each.
- Export or screenshot the diagnostics section for each template, highlighting render-blocking resources and oversized images flagged by the tool.
- Launch your site on a mobile device over a cellular connection and navigate through the purchase flow, noting any laggy interactions or layout shifts.
- Use your browser’s network inspector to identify the ten heaviest resources loaded on your product page, sorting by file size.
- List every third-party script or app loading on your homepage and product page, including analytics, chat widgets, and marketing pixels.
- Check your server’s Time to First Byte by refreshing your homepage several times and averaging the wait time shown in the network panel.
- Download your top ten product images to your desktop and verify their file sizes—if any exceed 200 KB, add them to your compression list.
- Review your theme or template settings to confirm lazy loading is enabled for images and that dimensions are set to prevent layout shift.
- Run a quick test on WebPageTest using a mid-tier device and 4G connection, focusing on the waterfall to spot long blocking resources.
- Compile your findings into three buckets: image optimization, script reduction, and caching improvements, ranking each by estimated impact.
- Pick the single highest-impact issue from your audit—typically oversized images or a heavy third-party script—and fix it today.
- Retest the affected template after deploying your fix to confirm the improvement and document the before-and-after metrics for future reference.
A Simple ROI Calculator
Faster pages convert more visitors into buyers and make every marketing dollar work harder. Estimating the revenue lift from speed improvements helps you prioritize optimization work and justify the time or budget required. The logic is straightforward: reducing load time increases conversion rate and lowers bounce rate, which translates directly into more completed orders and higher weekly revenue.
| Variable | Your Number | Example |
|---|---|---|
| Sessions per week | 10,000 | |
| Current conversion rate | 2.0% | |
| Improved conversion rate | 2.3% | |
| Average order value | $75 | |
| Estimated revenue lift per week | $2,250 |
To calculate your estimated weekly lift, subtract your current conversion rate from your improved conversion rate, multiply the difference by sessions per week, then multiply by average order value. In the example above, a 0.3 percentage point conversion increase on 10,000 sessions yields 30 additional orders, which at 75 dollars each generates 2,250 dollars in extra weekly revenue. Conservative estimates assume conversion rate improves by 0.2 to 0.5 percentage points when you fix major speed issues, though results vary based on how slow your site currently is and which templates you optimize.
Common Pitfalls
- Over-optimizing lab scores while ignoring field data from real users, leading to improvements that don’t translate into better actual experience or conversions.
- Focusing only on Largest Contentful Paint and neglecting Interaction to Next Paint, which directly affects user frustration and cart abandonment when buttons and forms lag.
- Uploading massive hero images at 3000 or 4000 pixels wide without resizing them for actual display dimensions, wasting bandwidth and inflating load times.
- Letting apps, plugins, and third-party scripts accumulate unchecked, each adding latency until the compounded effect cripples performance.
- Using unoptimized web fonts without subsetting, preconnecting, or setting font-display swap, causing both render delays and jarring layout shifts.
- Failing to set proper cache-control headers on static assets, forcing repeat visitors to re-download unchanged files on every session.
- Ignoring mobile network conditions and only testing on fast desktop connections, missing the experience your majority mobile audience actually encounters.
- Optimizing low-traffic pages like the homepage while ignoring high-conversion templates such as product detail pages and checkout.
- Assuming a single round of optimization is sufficient rather than monitoring metrics continuously and addressing new issues as your site evolves.
FAQs
How often should I test page speed? Run a full audit monthly or whenever you add significant features, apps, or design changes. Monitor Core Web Vitals weekly using field data to catch regressions early. Critical templates like checkout deserve more frequent checks, especially after plugin updates.
What should I do if my scores fluctuate widely? Field data naturally varies based on your traffic mix, device types, and network conditions. Focus on the 75th percentile thresholds rather than single-session outliers. Lab scores can fluctuate due to server load or third-party services; run multiple tests and average the results to identify true trends.
How do I balance beautiful design with fast load times? Modern optimization techniques let you preserve visual quality while improving speed. Use WebP or AVIF images at high quality settings, lazy-load below-the-fold content, and defer non-critical animations. Prioritize above-the-fold speed and let less visible elements load progressively. Design and performance are not mutually exclusive when you optimize smartly.
Should I go headless to improve speed? Headless architectures can deliver excellent performance by decoupling the frontend from backend systems, but they add complexity and development cost. Evaluate headless only if you’ve exhausted traditional optimizations and your platform’s architecture fundamentally limits speed. Most stores achieve good performance with well-optimized themes and disciplined app management.
How can I improve Interaction to Next Paint specifically? Reduce JavaScript execution time by removing unused code, deferring non-essential scripts, and breaking up long tasks. Minimize main-thread blocking by moving heavy computations to web workers or backend processes. Test interactions on mid-tier devices, which reveal performance issues hidden on high-end hardware.
How does caching work for logged-in users? Fully cached pages work best for anonymous visitors. For logged-in users, use edge-side includes or fragment caching to store static page shells while personalizing dynamic elements like cart counts and user names. Alternatively, serve slightly stale cached pages and update personalized data asynchronously with JavaScript after the initial render.
Does page speed affect SEO and paid media performance? Yes, search engines use Core Web Vitals as ranking signals, especially on mobile. Faster pages also improve quality scores in paid search platforms by increasing landing page experience ratings, which can lower your cost per click. Beyond algorithms, speed directly influences bounce rate and engagement, which indirectly strengthen SEO through better user signals.
Can I optimize speed without developer help? Many high-impact wins require no coding: compressing images, removing unused apps, enabling caching plugins, and adjusting theme settings. Platform-specific tools and plugins handle most optimization tasks through simple interfaces. Complex fixes like custom code splitting or advanced caching strategies benefit from developer expertise, but you can achieve significant improvements on your own.
Key Takeaways
- Page speed directly impacts revenue by reducing bounce rate, increasing conversion rate, and lowering customer acquisition cost, with even a one-second delay measurably hurting sales.
- Focus first on Core Web Vitals—Largest Contentful Paint, Interaction to Next Paint, and Cumulative Layout Shift—using both lab and field data to diagnose issues on your highest-revenue templates.
- Compress and resize images, optimize fonts, eliminate render-blocking resources, enable caching, and audit third-party scripts for immediate wins you can deploy without custom development.
- Prioritize fixes on checkout and product pages over homepage optimizations, allocating effort where speed improvements translate directly into more completed orders.
- Run the 15-minute audit checklist this week to identify your biggest bottlenecks, then tackle the highest-impact issue today and retest to measure the lift.
- Monitor performance continuously rather than treating optimization as a one-time project, catching regressions early and maintaining fast load times as your store grows.
Conclusion
Your store’s page speed shapes every interaction a customer has with your brand, from the first impression on a product page to the final click at checkout. Slow templates silently erode trust, inflate acquisition costs, and send buyers to faster competitors who close the sale while your page is still loading. This guide gave you a practical roadmap to diagnose sluggish performance, prioritize fixes that drive revenue, and deploy quick wins without needing a development team. The 15-minute audit you just learned walks you through identifying the heaviest images, the bloated scripts, and the missing cache headers that cost you conversions every day. Run that audit today, fix the single biggest bottleneck, and measure the difference in both Core Web Vitals and actual sales. Speed is not a technical nicety reserved for enterprise brands; it is a fundamental requirement for any ecommerce store serious about maximizing revenue from existing traffic. Results vary by site architecture, theme quality, traffic composition, and implementation rigor, but the ROI from faster pages consistently justifies the effort.